The Color Cloud: An interactive visualization of color names

A while ago, Randall Munroe of xkcd.com ran a survey. It showed you a random color and asked you to name it. With the combined power of lots of people on the Internet, it collected over two million data points about what people call different RGB colors. He put up the results for anyone to download.

As linguistic data sets go, this one is awesome. If you want to know what colors are named, you could go the prescriptive route and ask Pantone for a definitive list. Or you could go the descriptive route, and just ask people in general, two million times.

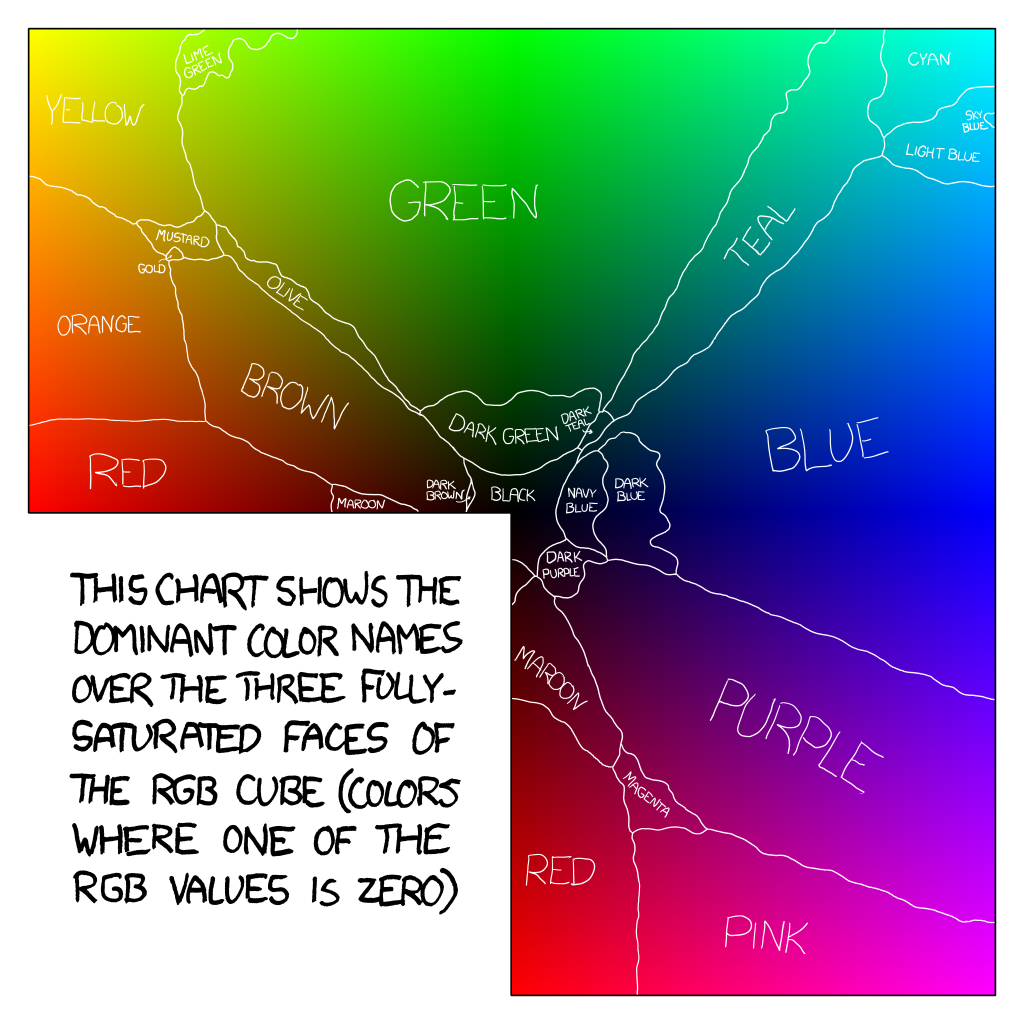
xkcd made some visualizations of parts of the space, like this diagram of the three saturated faces. That visualization is pretty cool, but it left me wanting more because that’s not nearly all the colors there are.

What if we could look through the color space, for example, and see all three dimensions of color at once? That usually doesn’t make a lot of sense, because the color space is solid. It doesn’t have gaps in it. You could try to make it semi-transparent or something, but then you’d just be seeing colors through other colors and it would be a mess.

But the space of color names does have gaps in it. Colors are a continuum, but color names are a sparse, finite set. So forget about the rest of the colors, because the colors that have names are interesting enough.

Word clouds

Probably our current favorite visualization at Luminoso is the word cloud. And when we say “word cloud”, we’re not talking about the amorphous thing you get out of something like Wordle. When we put words in different locations on the screen, those locations should mean something.

So we make sure to arrange them so that words with similar meanings stay together. Our ability to compare the meanings of words is based in part on our work with ConceptNet.

But enough about semantics, at least until later in the post. You’re here to see pretty colors.

The color cloud

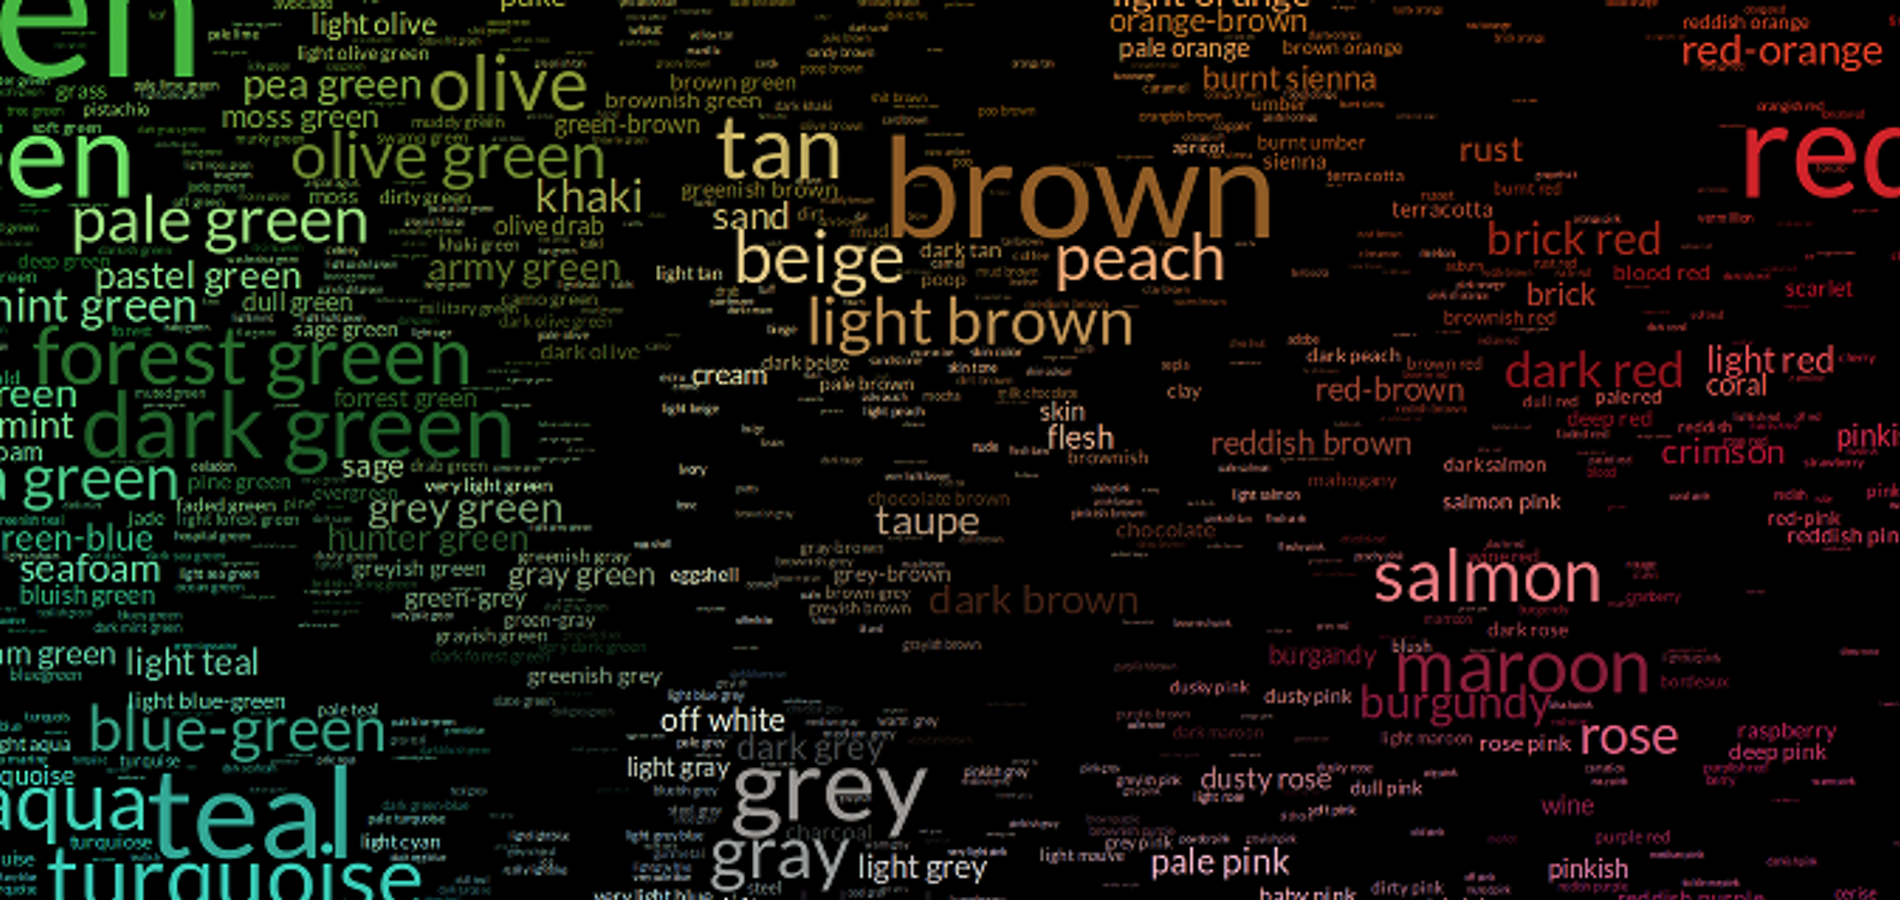
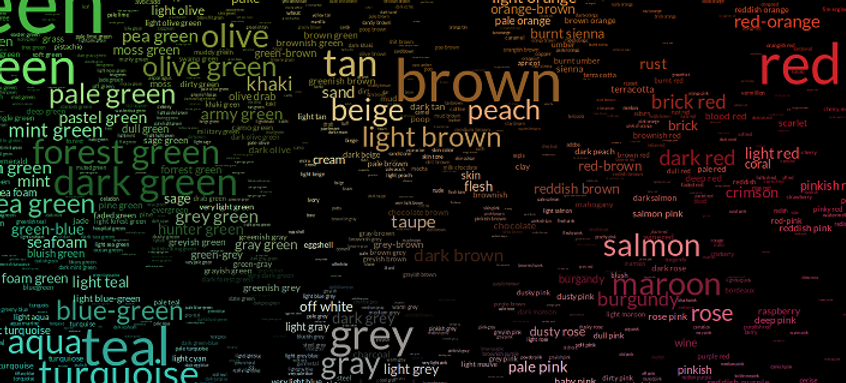
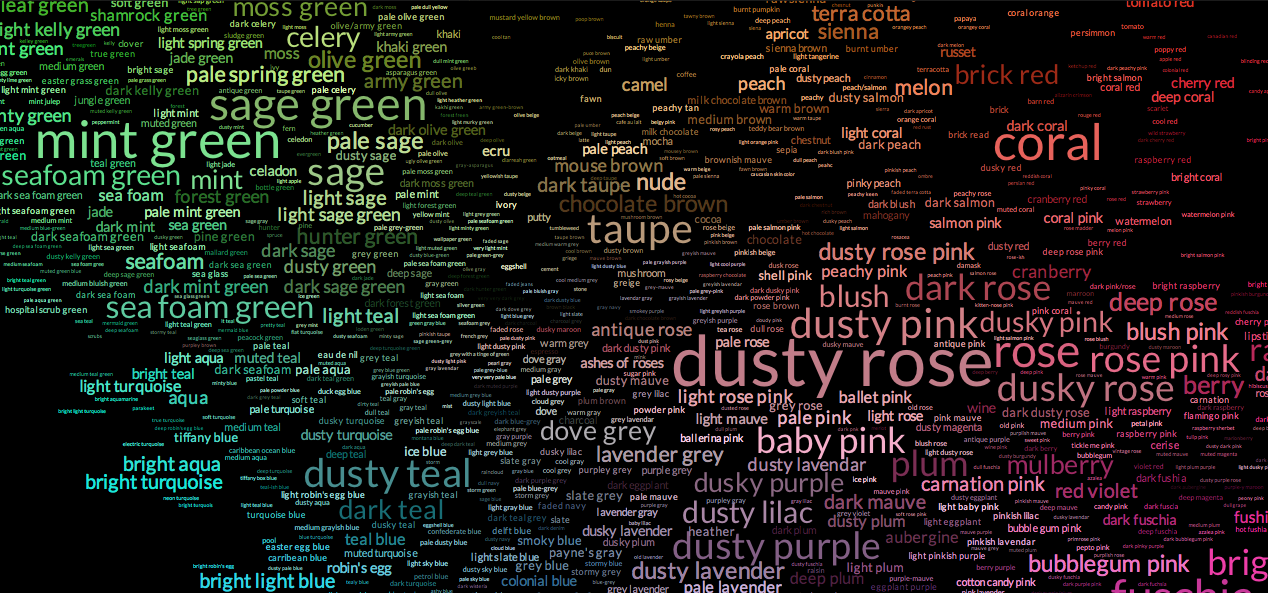
So let’s apply the same kind of layout to the color names that came back from the survey. Instead of arranging words by similarity in meaning, we’ll just arrange colors by similarity in color. The result is a visually stunning, fractal-ish view of the world of color.

Note: This visualization does some pretty complicated text layout and it makes your browser do all the work. As far as we can tell, it works eventually in most browsers that aren’t IE, but it’s only going to be a pleasant experience in Chrome.

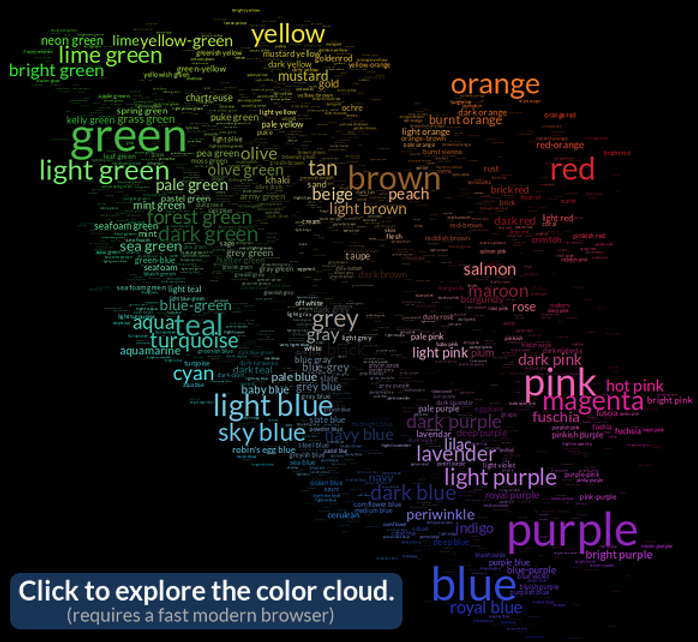
You might want to open that in a tab. We’re going to be referring back to it, and panning, zooming

, and rearranging it will be more fun than just looking at the cropped snapshots in this post.

After the fold, we explain how we chose the colors, why they’re in the locations they are, and how we can sort out color names into “male-centric” and “female-centric”, or sort them semantically into “colors people like” vs. “colors people don’t like”.

Building the visualization

Here’s how this visualization works:

  • We group together the responses by the color name that people gave.
  • People were seeing a variety of colors when they gave those responses, of course, so we collected the set of colors and found the one closest to the median.
  • Taking the median pretty much means we have to filter for color names that appeared at least three times. Despite the free-form responses, that’s actually a fair number of color names. You’d be surprised at the variety of names that appear three times, like duckweed, sky blue pink, deep purple (smoke on the water), 70s appliance green, and wednesday*. There’s also the fascinating pair blue enough and not blue enough, which were entered by entirely disjoint sets of people.
  • If the average color in the set is too far from the median, throw out this color name. This eliminates most of the spam and the responses that don’t refer to specific colors, such as “wtf”. A few false positives sneak through when people happen to give the same non-color response to similar colors, such as lol idk and does this end. At this point, we have 18168 colors we can name.
  • Put the more common colors in larger fonts — the area of a letter in a color name is proportional to the number of people who gave that response.
  • Arrange the color names in a suitable two-dimensional projection, dodging the names of larger colors so they don’t overlap. By default, I arrange them by their “chromaticity”, a two-dimensional measurement that includes hue and saturation, while ignoring lightness. I’ll get to the color theory behind this at the end of the post.

* Why is Wednesday a color? Why is it a consistent color? Why did I suspect it would be orangeish even before I looked up its median color? Brains are weird.

Revisiting the differences between sexes

During the time Randall’s survey was collecting data, a Doghouse Diaries comic was posted about what women and men call different colors. Randall was collecting data about X and Y chromosomes in order to look at colorblindness, but it seemed an excellent opportunity to address this question, as well, so he did.

For this post, when I say “women” and “men,” or “female” and “male,” I’m referring to the answers xkcd survey-takers gave to the question about whether they biologically have a Y chromosome, if they responded. A discussion that’s recently very heated in Western society is that of sex vs. self-identified gender, and it’s something Randall got significant feedback about because of this survey. He wrote a followup post on the topic.

Luminoso, as a company, discussed sex and gender for approximately a week while writing this post. At this point, we are agreed that we all have different perspectives on the topic, but we don’t all agree as to which terms to use to refer to the individuals who selected “yes” to the question “Do you have a Y chromosome?”, or how to accurately report on cultural gender differences in color naming based on a biological question. It’s challenging and important to pay attention to this, despite it not being the topic of this blog post.

Back to the results of the survey and original analysis — Randall concluded that, somewhat regardless of sex, the respondents actually do mostly tend to agree on what to call the colors of the rainbow. Here’s his version of the diagram.

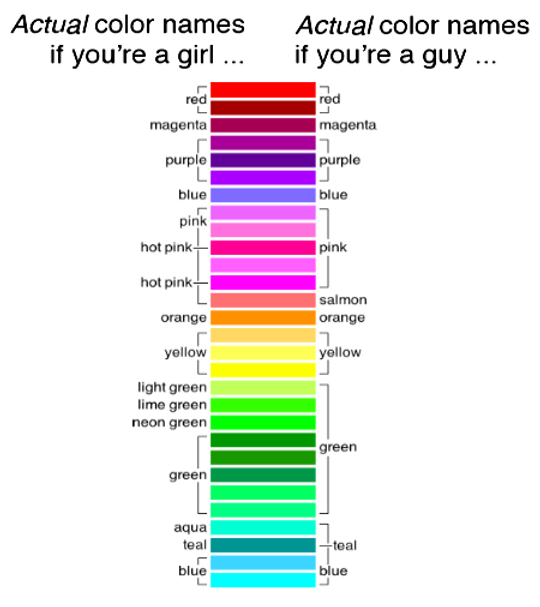
When we look back at the data, we find that the situation gets more interesting once we go below the rainbow surface. If you include less-saturated colors, you can find some pretty striking differences between the names given by men and women. To us, it looks more like the Doghouse Diaries version.

Randall searched for the “most feminine” and “most masculine” color names; you should be sure to read that part of the post because the results are hilarious.

I weep for my gender. – Randall Monroe

We don’t know exactly how Randall accounted for the number of total responses when making his top-5 lists. Certainly the “most feminine” colors aren’t just colors named by one female and zero males, for example.

We chose to apply a Student’s t-test, because it’s good enough for making beer and it’s good enough for us. Basically, the most masculine color names can be defined as the ones whose distribution of responses is most significantly above 62.8% male (the average male responses for the whole dataset), and the most feminine ones are the ones whose responses are most significantly above 37.2% female. (For this section only, we are omitting the 2.6% of responses from people who declined to indicate their chromosomes.)

The Student’s t-test is a measurement that increases not just as the percentage of male and female responses becomes more skewed, but also as the total number of responses becomes larger. You could say that this is designed to focus on the clearest differences, not the largest differences.

Also, this time, the top results will not be full of non-colors like “wtf” and “dunno”, because we’ve already filtered those answers out.

Here’s what you get:

Now let’s generalize a bit, based on data that becomes more obvious when using the word cloud visualization.

If you want to follow along with the statistics: Below, when I show a color and its name, the values that follow, such as (female=6.7), are the results of the t-test. A number greater than 4 represents an effect that’s very significant, occurring by chance less than .1% of the time for most sample sizes. We’ll show results where the t-test value is less than 4.0 in either direction as “non-significant”. By running 18,000 t-tests simultaneously, we will encounter the green jelly beans problem in a few cases, but most of these results have t-test values that are so enormously high that they wouldn’t occur by chance even in 18,000 tests.

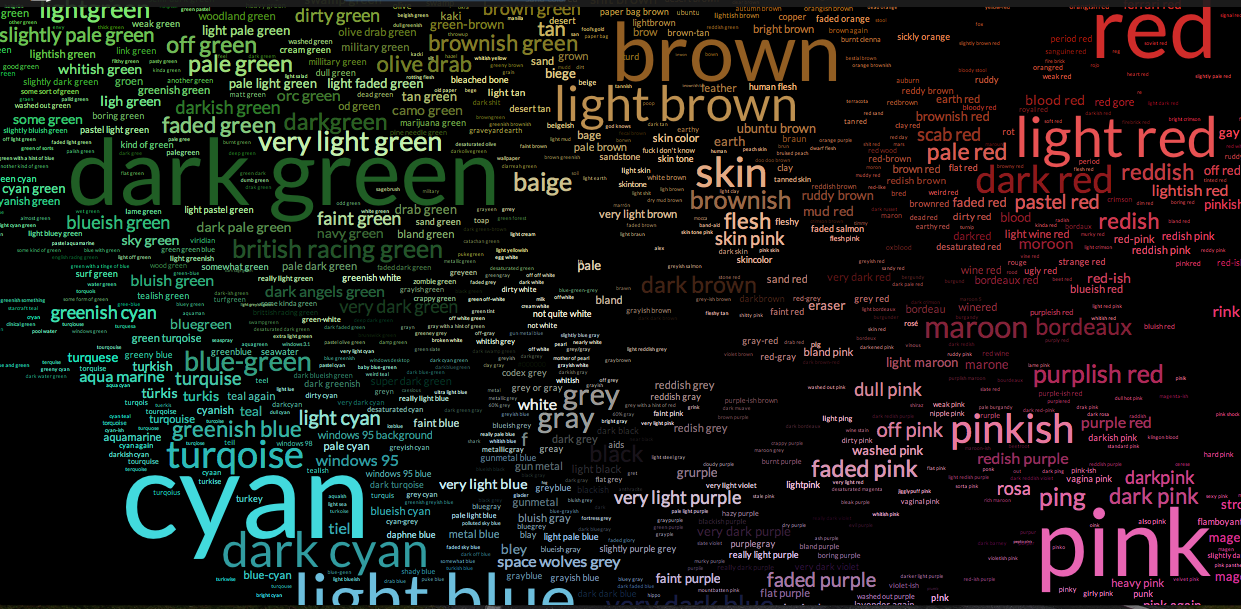
It’s true, males and females fundamentally agree on the rainbow. However, men really are more likely to use a simple rainbow color name such as red (male=37.4) or green (male=58.6), while women tend to at least add a descriptive word. In fact, the color name “green” (with no additional modifying words) has the single most significant difference between the sexes, with 71.6% of its 89494 responses being from men.

The main difference between the sexes is that, given a less-saturated color, men will often still call it by its rainbow color name, unless it’s desaturated enough that they call it a shade of grey like space wolves grey (male=7.1). Women more commonly add a descriptive adjective to distinguish shades, such as dusty red (female=6.7). In many cases, there is a separate name for the desaturated color that’s used much more by women, such as tawny (female=5.2), sage (female=27.3), taupe (female=28.1), or coral (female=34.3).

Spring green (female=50.7) is the queen of feminine colors, answered 2397 times by women and 767 times by men, but the less-frequent dusty rose (female=48.2) also has a solid claim on that title, with 1405 responses by women and 306 by men.

Besides the ubiquitous green, it’s apparently hard to get more masculine than cyan (male=54.1), answered 13336 times by males and only 3407 times by females. I’d theorize that’s because cyan is a nerdy technical color name that became popular because it’s a useful way to describe the color you get when you light up your RGB green (non-significant) and RGB blue (non-significant) phosphors equally, or the related color of ink that absorbs the most possible red light. While xkcd readers are nerds of all genders and sexes, it seems plausible that males would be the ones to predominantly choose this name in the presence of alternatives such as aqua (female=11.4) and turquoise (non-significant).

In fact, when we showed this post to xkcd employees, one such male employee was heard to exclaim, “That’s not cyan!” in response to the median cyan shade shown in this post, whereas one female Luminoso employee had to look the color up online to see what the fuss was about.

And yes, “baige” (male=11.1) is still men’s fault. We’ll focus more on misspellings in a bit.

Sorting names by what they mean

We mentioned that we can sort things out by their semantics, based on ConceptNet. So why not apply that to the color names?

Unlike what we usually do with Luminoso visualizations, we can’t use layout and color to convey these things, because we’re already using layout and color to mean what color it is. But we can show colors selectively, and emphasize colors by changing the font size.

One thing that came to mind is to focus on the “best” and “worst” colors, using semantic positivity and negativity associations that ConceptNet inherently utilizes. We created one view that emphasizes the colors with positive-sounding names, such as fiesta red, happy yellow, festive green, and sexy pink. Of course, we also made its opposite view, emphasizing the colors with negative-sounding names, such as sickening pink, prison grey, vomit, stupid purple, and screen of death.

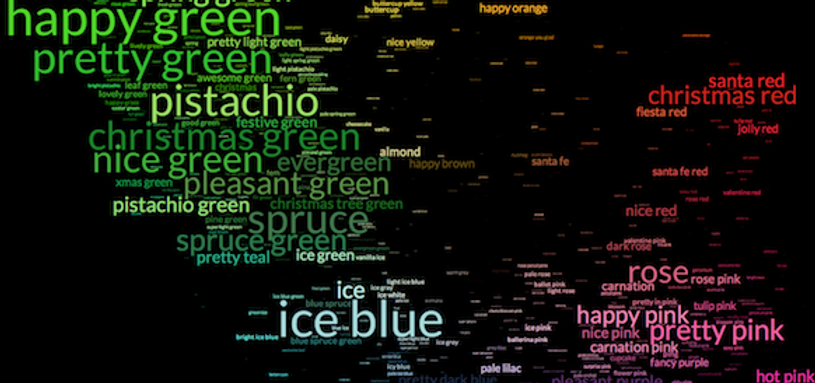
Yes, occasional results in there are weird. I haven’t yet looked into why ConceptNet is so fond of ice and so opposed to amber.

Goodness vs. badness isn’t the only kind of meaning we can identify based on concepts. A topic area that comes up a lot in color names is food. Lots of colors are named after edible things. Let’s make another view of color names that describe food:

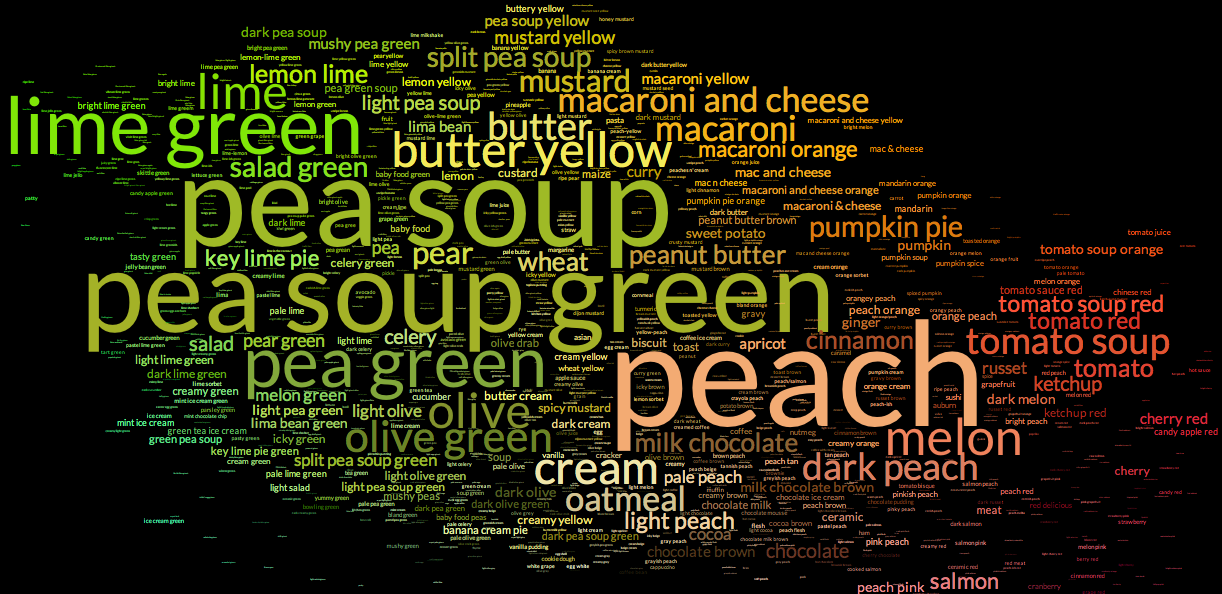
The interaction between food and color is interesting. Except for rare outliers such as grape and blueberry, this is the entire edible spectrum.

Misspellings and portmanteaus

Some of the color names in the results are ones that we could call “lexically creative”. They’re words you won’t find in a dictionary. In most cases, this is because we could also call them “misspelled”. Let’s focus on those for a moment.

Most wordlists out there have too many false negatives. For example, we shouldn’t flag the word “desaturated” just because the Official Scrabble Players’ Dictionary hasn’t heard of it. To find the most unusual words, we’ll compare to a wordlist we already use for other purposes, the Google Books 1-grams corpus.

Let’s say an unusual color name is one with a word that occurs so infrequently in print that it doesn’t make it into Google’s American English corpus, which is the largest of their 1-gram corpora that you can download. This means it occurs fewer than 40 times in over 100 billion words of American English. (Even British spellings show up there in statistically significant numbers.)

Here are the most common names that aren’t found in Google’s American English corpus, together with the number of times they appeared:

fuscia (2725), turqoise (2153), burgandy (1252), turquiose (716), turquise (597), pruple (576), chartruse (575), perriwinkle (573), purpley blue (572), blurple (548), purpleish blue (382), fuchia (373), fusia (372)…

So the most common of these are misspellings, especially misspellings of “fuchsia” and “turquoise”. Some of them use sensibly-spelled but informal adjectives, like “purpley” or “tealish”. My favorites are those that invent new color names as a portmanteau, such as blurple (548 responses) or grellow (67 responses). The most common example of a false negative where survey takers were smarter than Google Books was majorelle blue (21 responses).

So with this data, we can confirm what you’ve suspected ever since “baige” topped xkcd’s list of male-dominated colors. Male survey responders are somewhat more responsible for these unusual color words, which are mostly misspellings. Compared to 62.8% of responses from men overall, men are responsible for 68.1% of the unusual color words, and a t-test shows that as an extremely significant difference (male=25.8).

Color spaces

There is also some color theory behind the weird pointy shape we arrange the colors in, which might be good to explain at this time.

Computer screens inherently work with an RGB color space, building each color out of varying amounts of red, green, and blue light. When you pick an arbitrary color from the RGB space, there’s a good chance it’s going to be green. The green component of an RGB display is a frequency of light that the eye is very sensitive to, so green can easily drown out whatever else is going on in the color. Because the survey was sampling from RGB space, you can see this in responses such as green again (132 responses), still green (52 responses), and I’m sick of green (3 responses).

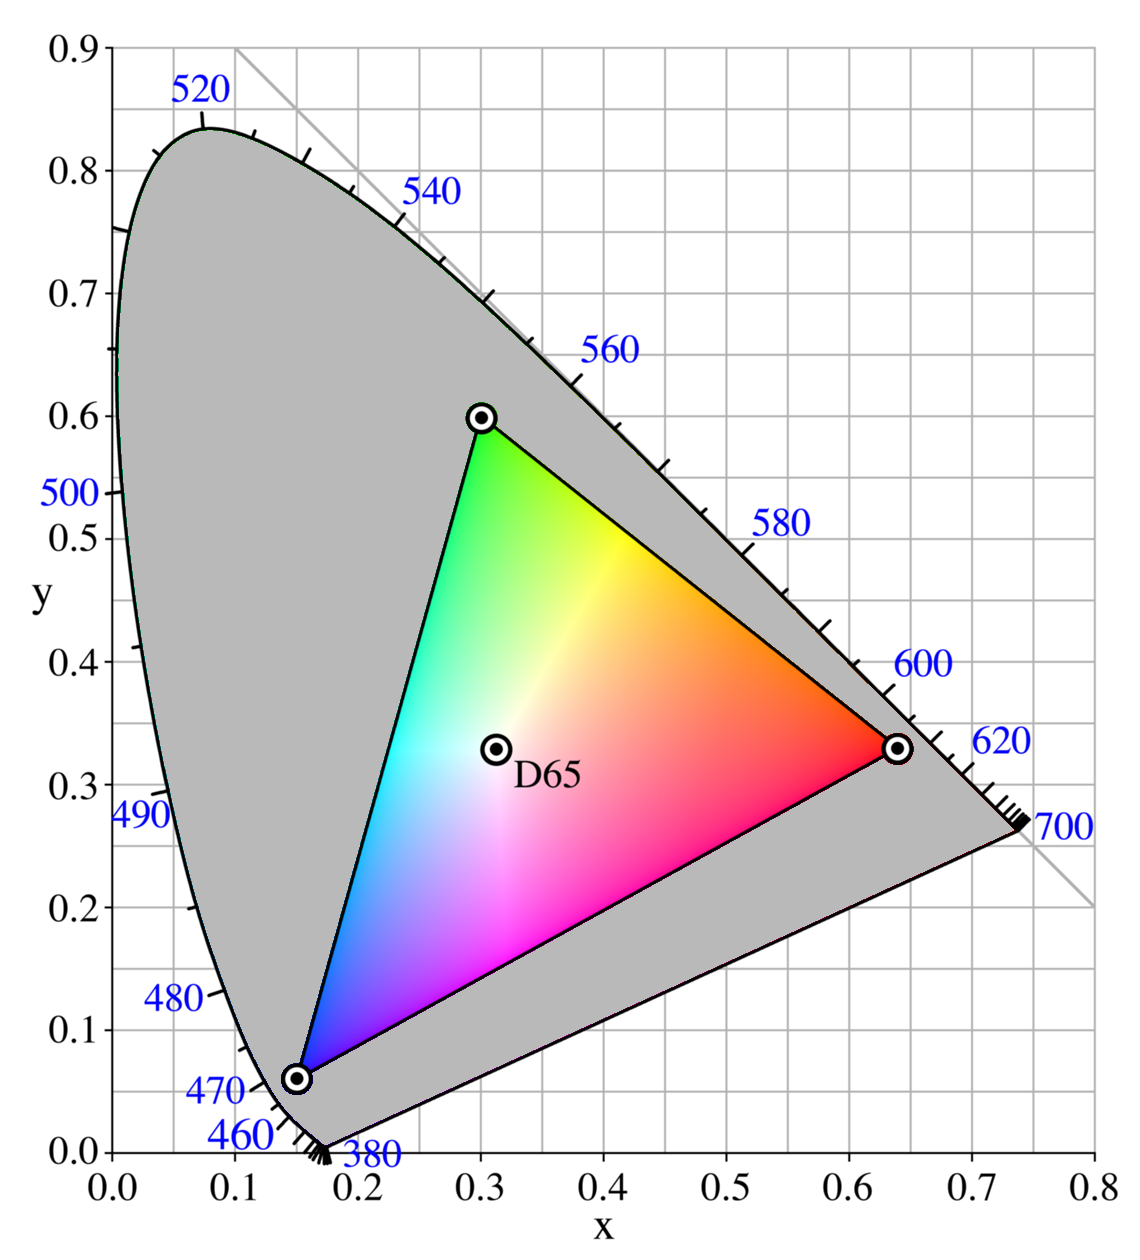
This diagram represents the space of physically possible colors (ignoring lightness), and it’s plotted linearly in terms of how the color is actually produced. The triangle represents the part of it that you can see on an RGB monitor. Look at the tiny little lines that cyan, magenta, and yellow get, compared to the vast expanses of green and shades of red. You’d be cramming a lot of interesting different color names together.

To represent the colors we actually care to distinguish, my preferred color space for showing a spectrum of colors is L*a*b*. (The asterisks mean its axes are nonlinear.) This space comes from measuring how people actually perceive color differences. A given distance in that space represents a corresponding difference in how people see the color.

L* is the component of luminance or perceived lightness, a* distinguishes red from green, and b* distinguishes yellow from blue.

Compared to a linear view of RGB space, this has the effect of squishing the greens and reds and creating much more room for all the different shades of purple, blue, and yellow. It also has the effect that, when you take the subset of the space a monitor can display, you get a pretty weird, wibbly-wobbly shape.

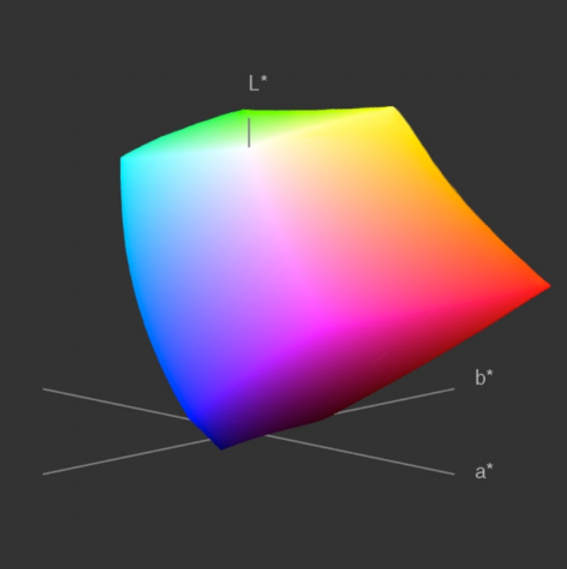
That’s the space we use by default for the visualization. You’re looking at it from the top down, seeing the a* and b* dimensions of the space. Colors with the same chromaticity but different luminance (L*), such as powder blue and navy blue, end up in the same place.

In the visualization, you can also choose from two more views that drop the a* or b* component instead. When you choose “red-green vs. lightness”, you’ll get an interesting-looking space where the blue vs. yellow component is ignored. It makes a kind of S shape because, again, you’re better at seeing the green your monitor produces than the red, so the greenest greens are perceived as brighter than the reddest reds.

Similarly, if you choose “blue-yellow vs. lightness”, the red-green component will be ignored. That one actually makes a pretty reasonable view of how red-green colorblind people will perceive differences in colors. It’s a space where brick red and forest green are almost the same, as well as teal and pink. The “red-green vs. lightness” space should be similar for blue-yellow colorblindness.

The “hue-saturation hexagon” is a view that’s like a traditional color wheel. I looked up the formulas for making a color wheel out of the RGB space, and I was not impressed by the step that basically says “now take the hexagon you got and distort it into a circle, because people like circles”. I left it as a hexagon, which seems like a more accurate representation of RGB.

In both the L*a*b* shape and the hue-saturation hexagon, you can see an interesting effect where the colors people agree on fall into particular bands by hue. Here I can see bands for red, orange, yellow, green, a continuum of teal-cyan-sky blue-azure-royal blue, then purple and magenta. Between many of these are noticeably sparse areas, for colors that people will tend to lump in with other colors more than they agree on a name for them. These “in-between” colors include ones we could call cerise, bittersweet, spanish orange, ecru, sage, and mauve.

And yes, I did just look up those names in the female version of the chart. I remember “bittersweet” from Crayola boxes, but I have never been sure what color “ecru” is.

I did the color space transformations for this visualization using python-colormath. I assumed that everyone’s monitors were calibrated to sRGB, though of course most monitors are not calibrated to anything in particular. I had to assume something. I could have tried to take into account the survey question that asked for your monitor’s color temperature, but hardly anybody answered that, and I don’t blame them.

Get the data

There’s certainly more we could have done with this data. A file that has all of the median colors in RGB could be a more convenient starting point than the original raw data, so here’s our version of the data in .json format. Interested? Have fun!

Related Posts

Step into the light

Targa Consulting

A data and analytics leader with 20+ years of experience in the pharmaceutical industry and a passion for business performance management, leveraging expertise in technology and client relations to define and develop innovative and high impact solutions.

Interested in becoming a partner? Contact Us Today!

About This Partnership

Targa Consulting Services, LLC specializes in strategic advisory for data and analytics, combining extensive industry experience with innovative approaches to technology and business intelligence. The firm is led by Jérôme Chabrillat, who has over two decades of experience in the pharmaceutical sector and a track record in leading data and analytics initiatives. Their services encompass developing and articulating data strategies, providing technology advisory, and enhancing data literacy within organizations. Targa Consulting aims to transform data-driven decision-making processes and foster a culture of data fluency in client organizations​.

The firm operates by understanding client needs, defining clear technology requirements, and creating enablement roadmaps to execute the envisioned strategies. They offer solutions that not only aim to accelerate insight and action but also focus on reducing operational costs significantly​.

KAPS GROUP

The KAPS Group is a network of consultants with a wide range of skills and experience in text analytics, taxonomy, ontology and knowledge graphs, Python and other proprietary text analytics programming languages, and information and knowledge management.

Interested in becoming a partner? Contact Us Today!

About This Partnership

The KAPS Group is a network of consultants with a wide range of skills and experience in text analytics, taxonomy, ontology and knowledge graphs, Python and other proprietary text analytics programming languages, and information and knowledge management. It was founded by Tom Reamy, author of the most comprehensive book on text analytics, Deep Text.

IBM

IBM Consulting’s watsonx practice brings expertise in the generative AI technology stack as well as domain and industry experience that can help accelerate clients’ business transformations

Interested in becoming a partner? Contact Us Today!

About This Partnership

IBM Consulting’s watsonx practice brings expertise in the generative AI technology stack as well as domain and industry experience that can help accelerate clients’ business transformations. In the same way that we established our successful Hybrid Cloud services business built on the Red Hat® OpenShift® platform, IBM Consulting intends to be the leading consulting services provider for watsonx. Businesses are demanding AI that produces accurate and trustworthy results, can scale across clouds, and can be easily adapted to enterprise domains and use cases. Watsonx is designed to help them address those needs. Let’s put AI to work and make the world work better — together.
Smart Insight Logo

Smart Insight

It features capabilities like natural language understanding AI and analytics, allowing for comprehensive data usage across organizations.

Interested in becoming a partner? Contact Us Today!

About This Partnership

Smart Insight, operated by Uchida Yoko Co., Ltd., offers digital transformation (DX) tools like Mµgen. Mµgen integrates various data types, including IoT and big data, and supports visual data integration, AI-driven text analysis, and advanced analytics. It’s designed for quick deployment, reducing data warehouse needs and implementation costs. The tool is used by companies like Toyota, Toshiba, and Yamaha for DX initiatives. It features capabilities like natural language understanding AI and analytics, allowing for comprehensive data usage across organizations.

EDLIGO

EDLIGO offers an advanced, AI-powered comprehensive Talent Analytics solution for data-driven talent management, workforce planning, project staffing, competency management, employee experience, and retention management.

Interested in becoming a partner? Contact Us Today!

About This Partnership

EDLIGO GmbH is a leading company specializing in AI-powered Talent Analytics. EDLIGO offers an advanced, AI-powered comprehensive Talent Analytics solution for data-driven talent management, workforce planning, project staffing, competency management, employee experience, and retention management. We believe that employees are lifelong learners, so we have built a comprehensive solution that empowers organizations to master all aspects of talent management, including learning and development, with data and AI to drive the highest business impact.

EDLIGO has a strong track record, with customers successfully using our platform in more than twenty countries, boasting more than 2 million users, and filing 17 patents. In 2023, EDLIGO was recognized as one of Germany’s top three most innovative mid-sized companies in software.

Zyte

Zyte is a leader in web scraping services, offering advanced data extraction tools and proxy solutions to power business data needs efficiently and reliably.

Interested in becoming a partner? Contact Us Today!

About This Partnership

Zyte provides a comprehensive web data platform, specializing in extracting and delivering structured web data at scale. They offer solutions like AI-powered automatic extraction, cloud hosting for crawlers, and a proxy manager for seamless data scraping.

Zyte’s services are beneficial for businesses needing large-scale, reliable web data for market research, competitive analysis, and data-driven decision-making.

Their tools cater to various data types including e-commerce products, job postings, news articles, and real estate listings, ensuring high-quality data extraction.

Salesforce

Salesforce is a leading CRM provider, offering a unified platform for sales, service, marketing, and customer engagement, integrated with AI for enhanced business growth.

Interested in becoming a partner? Contact Us Today!

About This Partnership

Salesforce provides a comprehensive CRM platform, integrating sales, service, marketing, and customer experience tools.

Their AI-driven approach ensures efficient data handling, personalized customer interactions, and streamlined operations.

The platform benefits businesses of all sizes by enhancing customer relationships, improving sales productivity, and enabling effective marketing strategies.

Salesforce’s solutions are adaptable across various industries, helping companies achieve growth and operational excellence.

RainFocus

RainFocus offers a comprehensive platform for managing in-person, virtual, and hybrid events. They specialize in data-driven event management, providing robust registration flows, attendee engagement, and seamless omnichannel marketing.

Interested in becoming a partner? Contact Us Today!

About This Partnership

RainFocus’s platform is designed to streamline event management across various lifecycle phases. It offers a unified approach to plan, manage, deliver, and optimize events, ensuring personalized attendee experiences.

Their solutions are beneficial for businesses seeking efficient event orchestration, as they enable data integration, flexibility, and customization. This approach results in enhanced attendee engagement, operational efficiency, and strategic marketing alignment.

HiFly Labs

Hiflylabs is a data solutions company offering data engineering, science, strategy advisory, and visualization. They focus on creating enterprise solutions with an emphasis on practicality and efficiency.

Interested in becoming a partner? Contact Us Today!

About This Partnership

Hiflylabs provides tailored data services, including data engineering, science, and visualization. They cater to various industries, offering specialized solutions like Appic for app development and Hifly SODA for sales-oriented analytics.

Their approach focuses on leveraging modern technologies and ecosystems like Databricks, dbt, and the Modern Data Stack, ensuring robust, flexible, and powerful tools for their clients. This helps clients optimize their data handling and business value creation processes.

Data Ideology

Data Ideology specializes in data strategy, engineering, AI, and analytics, offering solutions to maximize data-driven outcomes and insights.

Interested in becoming a partner? Contact Us Today!

About This Partnership

Data Ideology provides comprehensive data services, including strategy, engineering, AI, and analytics. They help businesses identify data-driven opportunities and create strategies for optimal outcomes.

Their services include building robust data pipelines, streamlining data processing, and leveraging AI for actionable insights.

This approach ensures data quality, compliance, and maximizes the strategic value of data assets, aiding organizations in making informed, data-driven decisions.

8x8

8×8, Inc. is a provider of integrated cloud communications and customer engagement solutions, offering unified communications, contact center, video conferencing, and team chat services.

Interested in becoming a partner? Contact Us Today!

About This Partnership

8×8 delivers a unified platform for contact center, voice, video, chat, and embedded communications. Their solutions focus on enhancing customer experience, agent engagement, and employee connectivity.

Offering reliable, secure, and compliant services, 8×8 integrates with business and CRM applications like Microsoft Teams and Salesforce.

Their technology supports businesses in various industries, ensuring efficient communications and collaboration, global reach, and data-driven insights.

Vatis Tech

Vatis Tech provides an AI-powered speech-to-text infrastructure tool, offering high accuracy and efficiency in transcribing audio and video data for various industries.

Interested in becoming a partner? Contact Us Today!

About This Partnership

Vatis Tech specializes in AI-driven speech-to-text technology, serving sectors like contact centers, broadcasting, medical, legal, media, and education.

Their platform features high accuracy, real-time transcription, and support for multiple languages and formats. It benefits users by enhancing data accessibility, improving workflow efficiency, and enabling more effective content analysis.

The technology is particularly beneficial for organizations needing rapid, precise transcription of large volumes of audio or video data.

OnlineSales

OnlineSales.ai is an advanced retail media monetization platform, offering AI-powered advertising solutions for retailers to optimize ad revenues.

Interested in becoming a partner? Contact Us Today!

About This Partnership

OnlineSales.ai specializes in retail media monetization with an AI-driven platform. It offers tools like sponsored product ads, display ads, offsite ads, and email ads to enhance digital marketing.

The platform enables retailers to increase ad revenues, deliver personalized shopping experiences, and automate ad campaign management.

Key benefits include maximizing ad spending, scaling advertising efforts, and providing an immersive shopper experience. The service is designed to be fully white-labeled and self-serve, ensuring user-friendly operation and customization according to business needs.

BabelStreet

Babel Street is a data analytics platform offering threat intelligence tools. They specialize in AI-enabled analysis of publicly and commercially available information for risk mitigation, fraud detection, and security.

Interested in becoming a partner? Contact Us Today!

About This Partnership

Babel Street’s platform empowers organizations with AI-driven insights from vast public and commercial data sources. It offers multilingual understanding, end-to-end automation, and extensive source access.

The platform is useful for threat intelligence, risk mitigation, and fraud detection. It’s valuable to government, law enforcement, and commercial sectors for its ability to process and analyze large volumes of data, helping them stay ahead of threats and risks.

Paychex

Paychex is a leading provider of integrated human capital management solutions for payroll, benefits, human resources, and insurance services.

Interested in becoming a partner? Contact Us Today!

About This Partnership

Paychex offers a range of services aimed at simplifying payroll and HR processes for businesses. Their solutions cover payroll, benefits, insurance, and HR administration.

By automating and streamlining these aspects, Paychex helps businesses save time and reduce errors. They cater to small and mid-sized businesses, providing tools for tax administration, employee onboarding, and regulatory compliance.

Their platform is designed to be user-friendly, ensuring a seamless experience for employers and employees alike.

Experience

Experience.com is a platform offering solutions for customer and employee experience management, as well as online reputation management, using AI-driven feedback campaigns.

Interested in becoming a partner? Contact Us Today!

About This Partnership

Experience.com provides AI-powered tools for managing customer and employee experiences, and online reputation. Their platform aids businesses in driving intelligent customer and employee feedback campaigns, amplifying marketing efforts, and enhancing customer-focused employee behavior.

It supports industries like banking, insurance, real estate, and healthcare, helping companies build a strong brand reputation and culture, ultimately leading to better client engagement and operational efficiency.

Qlik

Qlik provides data integration, data quality, and analytics solutions, integrating AI for advanced data management and actionable insights.

Interested in becoming a partner? Contact Us Today!

About This Partnership

Qlik offers a comprehensive data and AI platform, integrating data integration and quality solutions with advanced analytics and AI.

Their services help companies optimize data management, enhancing decision-making and operational efficiency. Qlik’s AI-assisted analytics empower users of all skill levels, facilitating better data understanding and use.

Their tools assist in data quality governance, real-time data movement, and machine learning, supporting clients in various industries to leverage their data effectively.

Databricks

Databricks specializes in AI and data intelligence, offering a platform that integrates data management, real-time analytics, and AI for efficient data processing and insights.

Interested in becoming a partner? Contact Us Today!

About This Partnership

Databricks provides a data intelligence platform, integrating ETL, data ingestion, business intelligence, AI, and governance tools. It helps organizations in efficiently managing and analyzing large volumes of data, aiding in better decision-making.

The platform is designed to simplify complex data processing, ensuring data privacy and control while developing AI applications.

Key benefits include streamlined workflows, enhanced data management, and the ability to drive insights using natural language. Databricks caters to various industries, optimizing operations and accelerating success in data and AI initiatives.

Knowledge Works Logo

Knowledge Works

KnowledgeWorks is dedicated to transforming education through personalized, competency-based approaches and systems change to benefit students and educators.

Interested in becoming a partner? Contact Us Today!

About This Partnership

KnowledgeWorks focuses on reimagining education to ensure all students, regardless of background, can thrive. They provide tools and guidance for personalized, competency-based learning, advocating for policies that support this model.

Their work includes strategic planning, workshops, and resources for educators and policymakers. By fostering student-centered learning environments, they aim to create equitable educational opportunities, preparing students for an evolving world.

Minerva Logo

MinervaCQ

Minerva CQ specializes in AI-enhanced support for contact centers, focusing on customer-agent interaction optimization through real-time assistance, workflow adaptation, and knowledge surfacing.

Interested in becoming a partner? Contact Us Today!

About This Partnership

Minerva CQ revolutionizes customer service in contact centers using AI. Their system analyzes millions of interactions to assist agents in real-time, offering insights, data, and workflow optimization.

This leads to personalized, efficient customer interactions. Key benefits include improved customer experience, reduced handle times, enhanced agent performance, and increased revenue opportunities.

Minerva CQ also focuses on reducing agent onboarding times and optimizing training, making every agent more effective in their role.

Clarteza Logo

Clarteza

Clarteza is an innovation agency specializing in consumer insights and brand strategy, leveraging AI, innovative research methods, and curated technologies to understand and connect with consumers.

Interested in becoming a partner? Contact Us Today!

About This Partnership

Clarteza focuses on driving brand innovation by deeply understanding consumer behavior and needs. They use AI and unique research methods to gather insights and translate these into actionable strategies for brands.

Their services benefit clients by enhancing brand positioning, improving consumer engagement, and guiding product development.

Clarteza’s approach helps brands connect with consumers more effectively, ensuring that their products and services are aligned with consumer expectations and market trends.

CEE Logo

The Centre For Educational Effectiveness

The Center for Educational Effectiveness (CEE) specializes in developing surveys, data tools, and services to support the growth of communities, districts, schools, and individuals. They focus on creating a positive impact in the educational sector since 1999.

Interested in becoming a partner? Contact Us Today!

About This Partnership

CEE partners with over 950 schools in 280 districts, offering services like strategic planning, coaching, professional development, and research projects.

They help educational institutions use data effectively, build strategic plans, improve leadership skills, and review programs objectively.

CEE’s approach centers on understanding and improving school climate and culture, enhancing performance, and promoting continuous improvement.

Realty Check Logo

Reality Check

RealityCheck is a full-service market research firm specializing in advanced qualitative analysis, quantitative research, and integrated qual/quant approaches.

Interested in becoming a partner? Contact Us Today!

About This Partnership

RealityCheck offers deep consumer insights for strategic decision-making in brand strategy, concept testing, and consumer experience mapping.

Their unique approach combines advanced qualitative and quantitative methods, focusing on the critical 10% of new information essential for business growth.

They excel in translating complex data into actionable strategies, aiding companies in understanding and engaging with their customers effectively.

Socratic Technologies Logo

Socratic Technologies

Sotech offers comprehensive research services including product testing, strategy consulting, message testing, and brand health tracking.

Interested in becoming a partner? Contact Us Today!

About This Partnership

Sotech is a leader in concept testing services. Sotech offers comprehensive research services including product testing, strategy consulting, message testing, and brand health tracking. They cater to various industries like consumer products, financial services, restaurants, and technology.

Their approach focuses on collaboration, innovative solutions, and strategic insights to help clients make informed decisions.

Sotech’s expertise in market research and concept testing enables businesses to understand consumer preferences, optimize product development, and enhance brand positioning, thereby ensuring customer satisfaction and market success.

Mckinney Logo

McKinney

McKinney & Company is a multi-discipline planning, design, and construction firm known for its innovation and comprehensive project delivery approach.

Interested in becoming a partner? Contact Us Today!

About This Partnership

McKinney & Company specializes in integrating multiple disciplines like architecture, engineering, and construction management to offer innovative and efficient solutions. With a commitment to collaboration and quality, the firm ensures projects are completed to a high standard, on time, and within budget.

This approach has led to its reputation for handling challenging projects and delivering lasting value, making it a trusted partner for clients seeking comprehensive, high-quality services in planning, design, and construction.

Shapiro+Raj

Shapiro & Raj

Shapiro+Raj is a strategic insights consultancy specializing in social science, data analysis, and creative strategies, with over 60 years of industry experience

Interested in becoming a partner? Contact Us Today!

About This Partnership

Shapiro+Raj is a future-forward insights consultancy recognized as a leading strategic insights firm. They are distinguished for being innovative, having earned a top-25 most innovative company recognition for five consecutive years.

As the largest minority insights company, Shapiro+Raj operates with an integrated team comprising social scientists, data analysts, brand strategists, and creative ideators. Their approach combines social science and behavioral economics, enhanced by a blend of technology and humanity.

The company boasts over six decades of experience in various industries and has contributed to over $100 billion in market cap growth for their clients in the past seven years

Company Name

Lorem ipsum dolor sit amet, consectetur adipiscing elit. Ut elit tellus, luctus nec ullamcorper mattis, pulvinar dapibus leo.

About This Partnership

Lorem ipsum dolor sit amet, consectetur adipiscing elit. Ut elit tellus, luctus nec ullamcorper mattis, pulvinar dapibus leo.